
The Long Tail Is Where You Lose — Regional and Use-Case Queries Are the Leak
When we decomposed AI citation loss by sub-intent between two early runs, almost all of it lived in the long tail: regional queries contributed a drop of 26 and use-case queries 19, while spec queries stayed stable and appliance queries even gained. Hero terms held; the tail leaked. This piece shows why the model retrieves differently for 'mixie for dhokla batter' than for a spec query, and why you defend the tail before the head.
Viren Inaniyan · September 10, 2026 · Citation Rank & Share of Voice
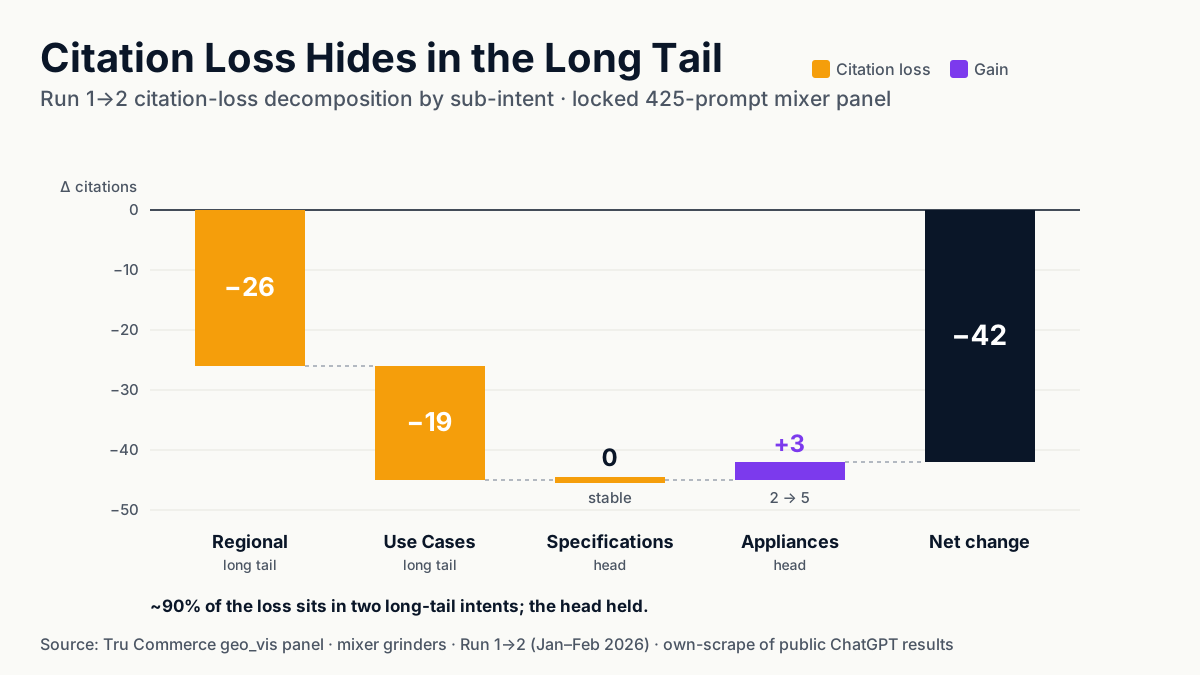
Averages lie about where you are losing. When we broke AI citation loss down by sub-intent across two early runs, the head of the category barely moved — spec queries stayed stable, appliance queries even gained. Almost the entire loss lived in two long-tail intents: regional queries and use-case queries. Your "best mixer grinder" ranking can look healthy while "mixie for dhokla batter" and "baby food grinder" quietly stop citing you. This is the piece about the leak you cannot see from the top line.
A category manager at a kitchen brand asked us a fair question on a call: "Our head terms in ChatGPT look fine — presence is up, we're getting recommended. So why does our own tracking feel like it's slipping?" The honest answer is that "head terms look fine" and "you are slipping" are both true at once, and they are true in different parts of the same category. The slip is in the tail, and the tail does not show up in a blended average.
This is the eighth piece in our Winning in AI Visibility with Amazon series, built on the same measurement spine as the rest: a locked panel of 425 real buyer prompts (mixer grinders) re-run monthly, stored in our geo_vis schema. Every prompt in that panel is tagged to one of six sub-intents — Regional, Use Cases, Price, Brands, Specifications, Appliances — which is what lets us do the thing a headline number cannot: watch each part of the category move separately.
The loss has an address, and it is the tail
Between the first two runs of the panel, the marketplace's citation footprint fell. That much is well established — we covered the mechanics of the broader collapse and its reversal in the Amazon shelf reversal. What that piece treated as one number, this one takes apart. When we decompose the same drop by sub-intent, it does not spread evenly across the category. It clusters.
| Sub-intent | Contribution to Run 1→2 citation change |
|---|---|
| Regional | −26 |
| Use Cases | −19 |
| Specifications | ~0 (stable) |
| Appliances | +3 (2 → 5) |
| Net change | −42 |
Two long-tail intents — Regional and Use Cases — account for essentially all of the loss. The head of the category did not participate. Specifications held flat. Appliances, a smaller intent, actually gained, moving from 2 to 5. If you had watched only a category-wide citation average, you would have seen a modest dip and had no idea it was almost entirely one thing: the model dropping the marketplace from regional and use-case answers while leaving the spec answers alone.
That is the whole argument in one table. The loss is not diffuse. It has an address.
Why the model drops the tail first
The mechanism is not a quirk. It falls straight out of how retrieval works, and once you see it you can predict it.
Different questions pull different kinds of evidence. A specification query — "1000W mixer grinder with 3 jars" — is a first-person, factual question, and the model answers it by reaching for pages that state specs: retailer product pages, above all. In our data, spec-oriented sub-intents pull retailer product pages far more heavily than the rest of the tail does. Retailer PDPs make up 13.98% of the citations on Specifications queries, against 7.65% on Regional and 6.23% on Use Cases. Spec answers are, structurally, the answers where a retailer's own page can still earn a citation.
Regional and use-case queries are a different shape. "Mixie for dhokla batter," "best grinder for South Indian cooking," "baby food grinder" — these are comparative, experiential, situational questions. The best answer to them is not a spec sheet; it is a thread, a buying guide, an editorial round-up where someone describes what actually worked for that use. When the model's evidence base shifts toward community and affiliate sources — the rewiring we documented across the panel — it is the long tail that loses its retailer citations first, because the long tail was leaning on community and editorial evidence all along. Spec queries, anchored to retailer PDPs, are the last to move.
So the concentration is not random. The tail leaks first because the tail was always the part of the category answered by sources you do not own. This is the same evidence-layer story we told in Reddit is the new PDP — that AI shopping gets its proof from threads, not product pages — now localized to a specific part of the category. Reddit and its neighbours are where the long tail's evidence lives.
The tail is bigger than it looks — because of fan-out
There is a reason the long tail matters far more in AI search than the phrase "long tail" suggests in classic SEO, and it is the single most important idea to carry out of this piece.
In search, one query becomes one results page. In AI shopping, one buyer question is rewritten into five to seven sub-queries before the model answers — the query fan-out we mapped earlier in this series. A shopper types one thing; the model quietly asks itself several. And those rewritten sub-queries are overwhelmingly the regional and use-case phrasings — "for idli batter," "under ₹5000 for a small kitchen," "good for wet grinding in a Chennai home." Your hero term is, at most, one branch of that fan-out. The other five or six are exactly the long-tail intents where our decomposition shows you disappearing.
Put those two facts together and the strategic picture flips. The long tail is not a low-volume afterthought you optimize once the head is handled. Under fan-out, the tail is most of what runs when a shopper asks a single question. Losing the tail is not losing a rounding error at the edges of the category. It is losing the majority of the sub-queries that decide a single recommendation — while the one branch you do track, the head term, keeps reporting that everything is fine.
Two qualifications keep this honest
First, this is a decomposition of one Run 1→2 movement, not a permanent law of the category. The panel's later runs show the citation graph continuing to rewire — some of that regional and use-case loss is recoverable, and the graph's volatility is precisely what makes it winnable rather than lost. The point is not "the tail is gone forever." It is "the tail is where the movement happens, so the tail is where you should be looking."
Second, we are measuring the citation layer here — which sources the model attributes — not placement. The marketplace's buy-links did not vanish from these answers; its citations did. As we have argued throughout, those are two separate layers, and they can move in opposite directions. Long-tail citation loss is an early-warning signal on the evidence layer, read it as a leading indicator, not as a same-day revenue number.
What this means if you sell on marketplaces
Stop grading yourself on the head. A category-level presence or citation average is dominated by your hero terms, which are the most stable and the least contested part of the surface. It will look reassuring right up until the tail has drained.
Instrument by sub-intent. Split your locked prompt set into regional, use-case, spec, brand, and price buckets, and track share of voice inside each one. The number that matters is not "are we cited in this category" but "are we cited on the regional and use-case queries" — because that is the surface the model demonstrably drops first, and the one that carries the most fan-out weight.
What this means if you run a D2C brand
The translation is direct and, if anything, more urgent, because a D2C brand's head-term visibility is often the only thing it looks at. Your brand name and your one flagship SKU are your head. They are also the queries where your own site and listings can still earn a citation, the spec-and-brand end of the tail. Everything a shopper actually asks — "which serum for oily acne-prone skin in humid weather," "gentle cleanser for a newborn" — is the use-case tail, and it is answered by exactly the community and editorial sources you do not control.
So the D2C playbook is the tail playbook: earn presence in the conversations that answer use-case and regional questions about your category, not just the ones that mention your brand. If you only defend your name, you are defending the one branch of the fan-out you were least likely to lose, and ceding the five or six that decide the recommendation.
What not to do
Do not chase the head harder because it is the number that is easy to move and pleasant to report. Pouring effort into a hero term that is already stable is optimizing the part of the category that was never leaking. It feels like progress and changes nothing about the loss.
And do not paper over the tail with volume. Spinning up hundreds of thin, near-duplicate regional pages — "best mixer grinder in [city]" × 400 — is the programmatic reflex, and the model treats it the way it treats any low-evidence content: it does not cite it. The long tail is lost in the citation layer, and you win the citation layer with genuine, experience-dense, third-party evidence, not with a page farm. Defend the tail with real answers to real use-case questions, in the places the model already trusts.
The measurement habit
The discipline is the same one this series keeps returning to, applied one level deeper. A locked prompt set, re-run on a schedule — but reported by sub-intent, not as a single blended average. Watch citation share for your regional and use-case buckets specifically, and watch the gap between your head and your tail. When the tail starts falling while the head holds, you have found the leak on the day it opens, not the quarter after it has cost you. A single headline number would have hidden the entire finding in this piece. The decomposition is the finding.
Averages tell you the category is fine. The tail is where you are actually being counted, and it is where you are actually being dropped. Book a demo if you want to see your own category split this way.
Next in the series: The Citation Graph Rewires Itself — half the leaderboard turns over in ten weeks, and why that churn is the opportunity.
FAQ
In AI shopping, one buyer question is rewritten into 5–7 sub-queries — many of them regional ('mixie for dosa batter') or use-case ('baby food grinder'). The model answers each, so the tail is not a trickle of low-volume keywords you can ignore; it is most of the queries actually running underneath a single prompt. Our panel shows visibility is lost there first, while the hero term still looks fine.
Because the model retrieves different sources for different intents. Spec-oriented queries pull retailer product pages heavily (13.98% of their citations in our data), so a retailer can stay cited there. Regional and use-case queries pull community threads, buying guides, and editorial — sources a retailer rarely owns. When the model's evidence base shifts toward those, the long tail loses its retailer citations while the spec head holds.
Lock a representative prompt set that deliberately samples every sub-intent — regional, use-case, spec, brand, price — and re-run it on a schedule, watching citation share per sub-intent rather than one blended average. The decomposition is what tells you the leak is in the tail; a single headline number would have hidden it entirely.
Sources
Continue reading
October 12, 2026
How a Claude shopping agent picks products
Anthropic ships no ranking layer. A Claude for Commerce shopping agent reads compact catalog rows of 70 to 120 characters that the merchant's own search returns, adds only server-issued ids to the cart, and never sees the checkout URL. Claude in Chrome reads the page and asks before buying. What is documented, what is not, and who filled the gap.
October 12, 2026
Claude commerce agents: what a merchant has to build
Anthropic's blueprint of 2 September 2026 hands a merchant's engineers a shopping agent, a merchant agent and an 11-method backend contract, and leaves payments, authorization, ranking and fraud to the deployment. The three runtime paths, where MCP enters, Shopify's UCP implementation, and what to build first.
October 12, 2026
Claude for Commerce explained: what Anthropic shipped
Anthropic published its commerce agents blueprint on 2 September 2026: a shopping agent and a merchant agent as open-source reference code, payment left to the merchant. What shipped, who is named, what the 35% figure describes, and what is still missing.