
AI Visibility Has Two Layers: The Placement vs Citation Dashboard That Actually Works
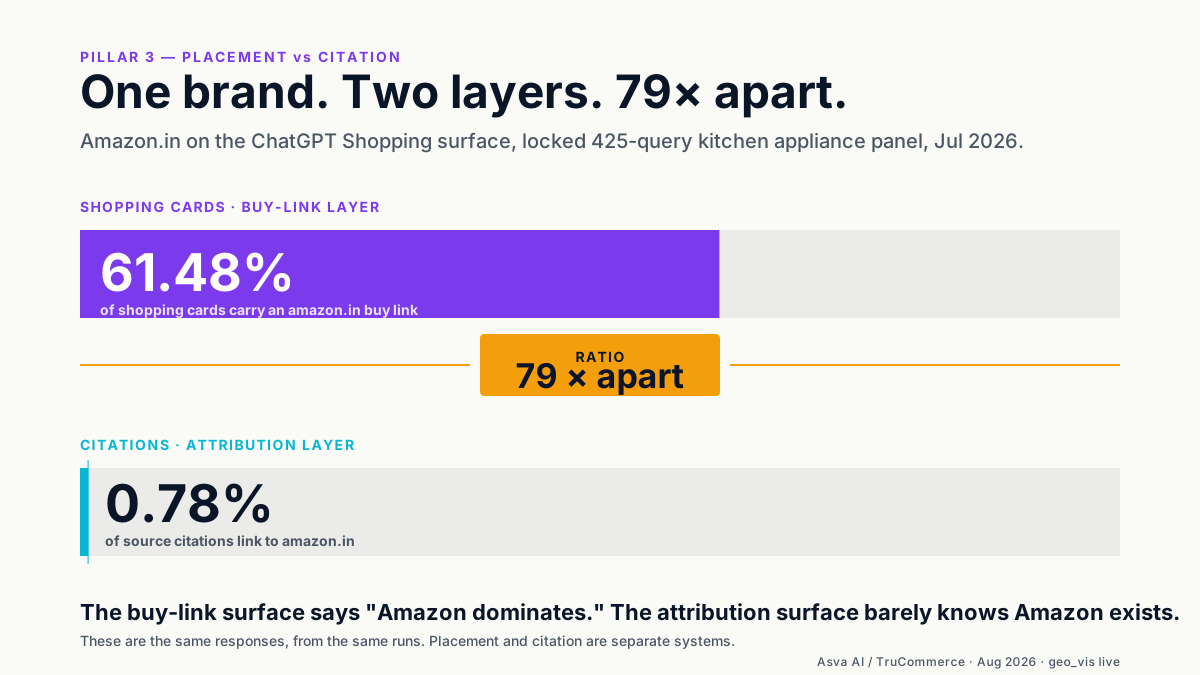
AI shopping answers have two independent layers - the products the model recommends (placement) and the sources it attributes the answer to (citation) - and every brand's AI-visibility dashboard is quietly blending them into one number that lies. On Amazon's India mixer-grinder data, one layer is 61.48% and the other is 0.78% - a 79× gap. On sunscreens the same structural pattern holds at 25×. And both layers moved in opposite directions twice in eight months. Here is the four-KPI-group model that fixes it.
Viren Inaniyan · August 7, 2026 · Citation Rank & Share of Voice
Everyone measuring AI visibility right now inherits the same instinct from a decade of SEO: the link is the win. Count who cites you, weight by authority, chase citation share. In AI shopping that instinct is not just wrong - it's inverted. You can be recommended without being cited, cited without being recommended, and you can watch either metric collapse without the other moving. If your dashboard blends the two into a single "AI visibility score," you are not measuring anything you can act on. This piece is the mental model that resolves the mismatch - the two-layer model - plus the KPI structure it forces, and the four failure modes it makes visible.
Answer Engine Optimization ("AEO" - the polysemous acronym; disambiguating early because in India the same three letters more commonly mean Airport Equipment Operator or a couple of other things) and Generative Engine Optimization ("GEO") are two of the fastest-growing keyword clusters of 2026 - the entire "AI visibility tools / tracker / checker / score / audit" search vocabulary is up 500-4,700% year on year, off a low base. A category is being formed in real time. Which is exactly why the mental model you settle on right now matters. Bad mental model + fast-growing category = bad KPIs baked into a lot of dashboards.
Here is the model that survives contact with live data.
The two layers, defined
An AI shopping answer has two parts.
The placement layer - what gets recommended. This is the product card the user sees with the buy-link they can click. It is the purchase surface. In ChatGPT Shopping this manifests as the product carousel, the "Buy at [retailer]" buttons, and the offer block with prices from multiple marketplaces.
The citation layer - what gets attributed. This is the source the model points at as the reason for its recommendation. The "[1] according to livemint.com," the "you can also see reviews on Reddit," the footnote-style attribution. It is the evidence surface.
Two entirely different things. A citation is not a purchase link - it is a justification link. A modern generative model is fully capable of recommending a product from evidence that does not include the product's own PDP. It happens on every prompt, all the time.
The 79× gap: Amazon on mixer grinders
Concretely, on Amazon's live mixer-grinder data:
| Layer | Metric | Value |
|---|---|---|
| Placement | % of shopping cards where amazon.in appears as a buy-link | 61.48% (24,467 of 39,796) |
| Citation | Amazon citations ÷ all citations (full dataset) | 0.78% |
| Citation | amazon.in specifically | 0.74% (846 of 114,705) |
| Content mix | Non-retailer share of all citations | 97.57% |
Amazon is on the majority of buy-link slots for the category, and a rounding error in the citation graph - a 79× gap between the two layers.
That is not a contradiction. It is the two-layer model made numerical. When ChatGPT recommends a mixer grinder in India, the recommendation lands on Amazon 60%+ of the time. When ChatGPT explains why it made the recommendation, it points at Reddit, at niche affiliates (bestmixergrinder.com is the current #1 cited domain at 784 cites, more than 4× its May count), at editorial buying guides, and - a new-in-2026 pattern - at the manufacturer's own website. Almost never at Amazon's product page.
The Beauty check: same shape, different category
If this were a mixer-grinder quirk, the model would matter less. It isn't. On the live Sunscreens and Moisturizers pulls for the same marketplace:
| Category | Cards | % of cards with Amazon buy-link | Citations | Amazon citation SoV % |
|---|---|---|---|---|
| Sunscreens | 5,182 | 36.3% | 45,773 | 1.47% |
| Moisturizers | 2,087 | 35.1% | 10,173 | 3.06% |
Placement in the 35% range. Citation in the 1-3% range. A 12-25× ratio, in a completely different vertical, on a completely different prompt set. The structural pattern holds.
Amazon is a placement brand in AI shopping and a near-invisible citation brand. That is the actual scoreboard. The model recommends Amazon products; it credits other sources for the choice. That is not an accident, and it is not a bug. It is the mechanical shape of every generative-search product recommendation.
The two layers move independently, in either direction
The previous piece in this series walked through the timeline. Compressed: on the same 425 mixer-grinder buyer-prompt locked set, we now have three data points.
| Metric | Jan 2026 | May 2026 | July 2026 |
|---|---|---|---|
| Amazon Presence % (of all 425) | 80.00 | 96.26 | 62.35 |
| Amazon own-citation % (of present) | 17.65 | 1.91 | 7.17 |
Between January and May, placement rose 16 points while citation fell 16 points. Between May and July, placement fell 34 points while citation recovered 5 points. The two layers moved in opposite directions in both two-quarter windows, on the same prompt set, in the same category. They are not coupled in any measurable way.
The instinct to build a composite "AI visibility index" - 60% placement, 40% citation, weighted, averaged - dissolves in front of this data. A composite score would have been stable between January and May (opposite moves cancel out) and stable between May and July (opposite moves cancel out again) while the underlying reality shifted radically twice.
Four KPI groups, not one
A working AI-visibility dashboard has four separate groups of metrics, tracked independently, and read in relation to each other rather than summed.
1. Placement scoring - the "am I in the answer" layer.
- Presence % - share of queries where you appear at any rank (query-level).
- Avg best-card position (1-based) - mean of the best card you hold across responses where you're present.
- Top-1 / Top-3 rate - share of appearances that land in the top slot / top three.
- Price competitiveness % - share of cards where you are the cheapest-or-tied offer.
- Badge share - % of "Best price"-tagged cards in the category where you are a marketplace. (Amazon: 56% on mixers, 63% on sunscreens.)
2. Citation scoring - the "am I attributed" layer.
- Own-citation % of present - share of Amazon-present responses that include an amazon.in citation.
- Own-citation SoV - Amazon citations ÷ all citations.
- Prompts-with-any-citation % - sanity check that the model is producing citations at all.
3. Graph inspection - the "who is the model listening to" layer.
- Top-N cited domains, by run. Track the leaderboard. Flag entrants.
- Content-type mix - retailer PDP vs best-of guide vs editorial vs community vs blog vs manufacturer.
- Brand-owned domain count in top-15 - a leading indicator of placement moves. On our mixer data this indicator went from 0 to 3 between May and July, and predicted the placement drop.
4. Shelf integrity - the "did the surface render at all" layer.
- % responses with zero shopping cards. On our locked-425 mixer set this jumped from 5% (Jan) to 56% (May) to 16% (July) - the single largest mover of any placement metric, and easy to blame on the model when it is really the shelf.
- Avg cards per response.
- % cards with no working buy-link. In beauty this went from 97.9% (Apr 13) to 2.7% (Jul 10) - a real broken → fixed arc that would have looked like a magic placement shift if you were only watching Group 1.
Every insight worth having lives in the relationships between these groups. Placement fell but citation held? Check the graph - probably a rewire that promoted brand-owned sources. Both fell together? Check shelf integrity - probably the surface itself thinned. Presence stable but Top-1 collapsed? Not a two-layer story, more likely a competitive-price story from Group 1.
The four failure modes a single-score dashboard hides
Because the two-layer model is real (and has now reversed twice on the same prompts), it is easy to enumerate what a blended "AI visibility score" would miss.
Failure mode 1 - the vanity-citation trap. You optimize for citation share. You win Reddit and buying guides. Your citation number climbs from 2% to 10%. You declare victory. Meanwhile placement fell 20 points because brand-owned domains started appearing in the top-15 cited sources and eating buy-link share. Your composite dashboard shows "slightly up." Revenue disagrees.
Failure mode 2 - the placement-only trap. You track only Presence and Top-1. Both look great for six months. Then citation share collapses to 1% and you have no diagnostic - no way to see the graph rewire that is about to eat your placement in the next quarter. You find out from the placement move, not from the leading indicator.
Failure mode 3 - the shelf-integrity blindspot. Presence numbers move sharply. You start investigating your PDPs. It is actually because the model started returning zero-card responses on 15% of queries - a shelf-integrity issue, not a competitive issue. Every hour spent on PDP fixes is wasted; the actual fix is upstream in feed hygiene.
Failure mode 4 - the composite-noise cancellation. Placement moves +10, citation moves −10, both real and both meaningful; your composite score is 0. You conclude nothing happened. Meanwhile the entire character of your AI presence just changed and you have no visibility into it.
A dashboard that shows these four groups side by side, weekly, on a locked prompt set - that is the actual instrument. There is no shortcut to it, and no single-number substitute.
The Amazon proof-point: dominating one layer while being invisible in the other
There is a live demonstration of the two-layer model running right now in ChatGPT India. Amazon is:
- Dominant in the placement layer. 74% presence on the healthy carded mixer shelf on 2026-07-23. Avg position 1.36 on brand queries - nearly always the top slot when it shows. 210 dual-wins on 425 buyer prompts (top-2 + cheapest-or-tied). 56% share of the "Best price" badge on mixers, 63% on sunscreens.
- Near-invisible in the citation layer. 0.78% of all citations. amazon.in did not appear in the top 15 of either the May or the July citation leaderboard for the category, even after a 5× recovery from May's 8 citations to July's 42.
Amazon is not losing. Amazon is playing a two-front game and winning the front that matters. The buy-link is the purchase surface. The citation graph is the evidence surface. Amazon captures the buy-link roughly 60% of the time; brand websites, community, and niche affiliates capture the evidence layer. When both flows converge on the same recommendation - which they usually do - the buyer clicks Amazon.
That is the two-layer model, working as intended, in the largest AI shopping surface in India, on live data, right now.
Why review count is the underrated Group 4 signal
One data point that made the underlying story a lot cleaner when we pulled it: on the July 23 mixer batch, the cards that carry an Amazon marketplace have 1.8× the average review count of cards that don't (343 vs 191 avg reviews) and are 2.2× as likely to carry any review data at all (33% vs 15%). Average ratings on the two sets are identical (4.38 vs 4.40).
The model isn't ranking Amazon-carrying products because they are better products. It is ranking them because their PDPs are richer - more reviews, more structured data. Review count is a Group 4 hygiene signal that behaves like a Group 1 competitive lever. If your brand's PDPs sit below the ~1,000-review threshold, you are competing with one hand tied behind your back before the ranking layer even runs.
What to do on Monday
- Stop reporting a composite AI-visibility score. Show the four groups separately. Let the reader look for the relationships.
- Instrument all four groups on a locked prompt set. The measurement is only meaningful when the denominator is constant. If your prompt set changes week to week, so does the number, and the story is unreadable.
- Add the graph leaderboard to your weekly review. Not as a KPI - as a diagnostic. Circle new entrants, especially brand-owned domains and new-to-top-15 affiliates.
- Track shelf-integrity as a first-class metric. % zero-card responses, avg cards, % broken buy-links. In emerging categories (beauty, home, D2C-heavy verticals), this is the largest single mover of any placement metric.
- Track the "Best price" badge separately. ChatGPT ships exactly one badge across its whole shopping surface. On mixers Amazon owns 56% of it; on sunscreens 63%. This is the single-highest-leverage visual signal on the surface and no dashboard I have seen tracks it yet.
- Report Presence twice. Once against all prompts, once against the carded subset. The gap between the two is your shelf-integrity story.
The two-layer model is a mental model, not a slogan. Use it to argue with your dashboard, not to redesign it into a slogan of its own.
We used this exact playbook with House of Zelena, taking them from 22% to 56% ChatGPT mention share in 6 months - read the House of Zelena case study. If you want to see where you stand before committing, start with Share of Voice.
FAQ
The measurable presence of a brand or product inside generative AI responses - ChatGPT, Perplexity, Claude, Gemini, Google AI Overviews, Bing Copilot. It has two independent layers: placement (whether the brand's product or offer is recommended) and citation (whether the brand's own domain is credited as the source).
Placement is what gets recommended - the buy-link or product card the shopper actually sees. Citation is which sources the AI attributes its answer to - the "according to" footnote links. They are two independent layers, and they can move in opposite directions on the same query set. On Amazon's mixer-grinder data, amazon.in is a buy-link on 61.48% of cards but only 0.78% of citations - a 79× gap.
Use four independent KPI groups: Placement (presence, position, top-N rate, price competitiveness, badge share), Citation (own-citation rate, citation SoV, prompts-with-any-citation), Graph inspection (top-N cited domains, content-type mix, brand-owned domain count), and Shelf integrity (% zero-card responses, avg cards per response, % broken buy-links). Track all four on a locked prompt set. Read the relationships between them; do not blend them into a single score.
Because placement and citation move independently - often in opposite directions. On the same 425-prompt locked set for Amazon, they moved in opposite directions between Jan and May 2026, and in opposite directions again between May and July 2026. A composite score cancels the opposite moves to zero and hides both real reversals.
Sometimes, but not reliably. Assume independence. Every measurable AI-visibility system we have run on real prompt sets shows placement and citation moving independently on cycles as short as two months.
Amazon dominates the placement layer (74% presence on the healthy carded shelf, 56% of the "Best price" badge on mixers, 63% on sunscreens) while nearly ignoring the citation layer (0.78% of all citations). The buy-link is where the transaction happens. Amazon plays that layer; brand websites, community, and niche affiliates play the citation layer. Both flows converge on the same recommendation - and the buyer clicks Amazon.
Continue reading
August 7, 2026
Query Fan-Out: One Question Becomes 5-7 Searches (And ChatGPT Rewrites All of Them)
A user typed 'ALTRR Portable Spice Mill (200W)' into ChatGPT. The shopping backend searched 'portable spice grinder travel' - brand stripped, spec dropped, intent added. That rewrite is stamped into every card's payload as generated_product_query, and it is only one branch of a fan-out that turns a single buyer question into 5-7 sub-queries across 8 distinct axes. Classical SEO optimizes one keyword per page. AI shopping ranks you across the whole fan-out - which is exactly why Amazon holds 63-79% presence on every sub-intent type we measure.
August 7, 2026
The 86% Rule - In AI Shopping, Eligibility Beats Ranking
When a retailer product page gets cited in a ChatGPT shopping answer, it wins the top recommendation slot 86.03% of the time - the highest hit rate of any content type in an 18,942-citation dataset. But retailer pages are only 8.28% of what ChatGPT cites. That inversion rewrites the whole playbook: the scarce, high-conversion battle in AI shopping is getting cited at all, not ranking once cited. Here are the three gates that decide citation eligibility - reviews, product-type fit, sub-intent presence - and the two beloved PDP levers that tested statistically dead.
August 7, 2026
The Amazon Shelf Story: What Really Happened to Amazon in ChatGPT Shopping Between May and July 2026
Everyone screenshotted the May chart: Amazon's ChatGPT presence rose to 96% while its citation rate collapsed to 1.91%. Two months later, on the exact same 425 buyer prompts, both metrics reversed - and the popular narrative got the story completely wrong. The 96% was on a half-empty shelf (56% zero-card responses). The July shelf is about three times healthier. And Amazon still wins the top-2 slot plus cheapest price on 210 of those 425 prompts. Here is the reverse-engineered version of what actually moved.