
The Amazon Shelf Story: What Really Happened to Amazon in ChatGPT Shopping Between May and July 2026
Everyone screenshotted the May chart: Amazon's ChatGPT presence rose to 96% while its citation rate collapsed to 1.91%. Two months later, on the exact same 425 buyer prompts, both metrics reversed - and the popular narrative got the story completely wrong. The 96% was on a half-empty shelf (56% zero-card responses). The July shelf is about three times healthier. And Amazon still wins the top-2 slot plus cheapest price on 210 of those 425 prompts. Here is the reverse-engineered version of what actually moved.
Viren Inaniyan · August 7, 2026 · Citation Rank & Share of Voice
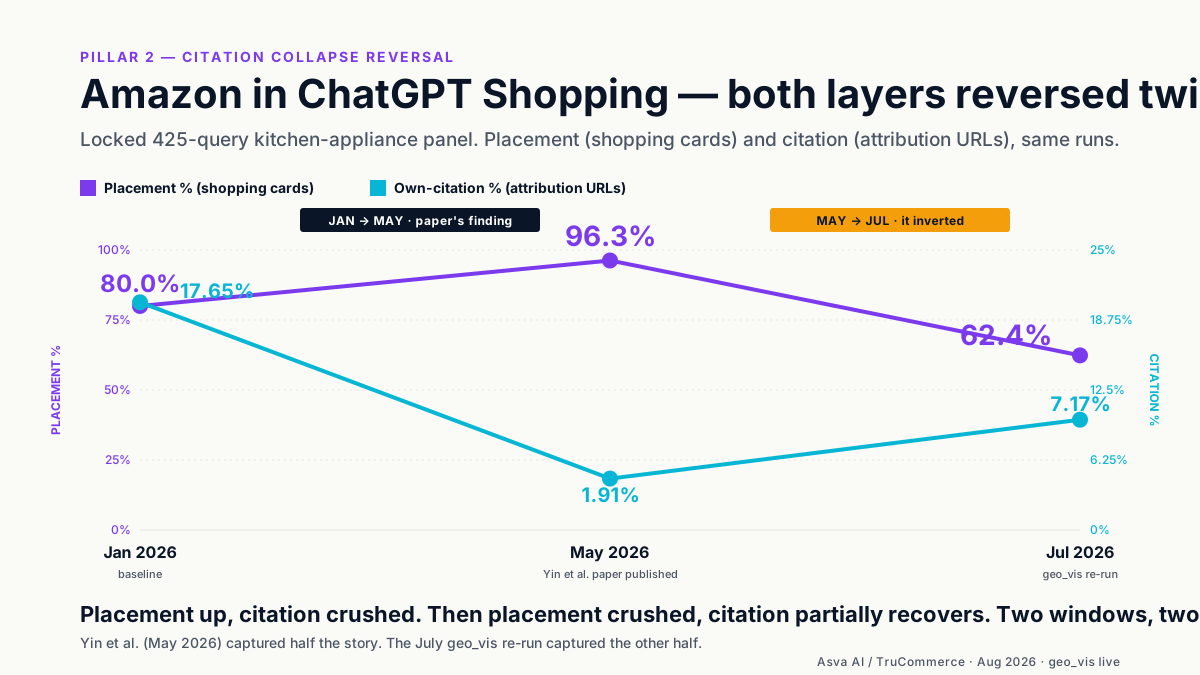
In May we published a longitudinal study of how ChatGPT recommends products for Amazon in one high-competition category - mixer grinders. Every serious AI-visibility deck built between June and August has one chart from it: Presence rising from 80% to 96% while own-citation crashed from 17.65% to 1.91%. It became a slogan - "placement and citation have decoupled." Two months later, on the exact same 425 prompts, both numbers reversed. The chart got screenshotted. The lesson got mis-read. This piece is what actually happened.
Data note (updated 2026-08-25). Two figures in the original May paper were wrong. The May zero-card rate was inflated by a response-selection artifact - the panel ran twice that month and taking only the latest response per prompt discarded the first run's cards. Counted per prompt across the full May window, 238 of 425 prompts returned no cards, so the figure is 56%, not 87%. Separately, the much-quoted 96.26% May presence was measured on carded responses only; across all 425 prompts Amazon's May presence was 42.4%. Like for like, Amazon's reach went 42.4% → 62.4% between May and July, a 1.47× gain rather than the 5× first published. July is unchanged at 16.2% zero-card. The direction of the story is unaffected; the magnitude is smaller.
Between January and May 2026, Amazon's Presence in ChatGPT Shopping for mixer grinders went from 80% to a widely-quoted 96.26% - a figure measured only on the responses that actually rendered a shelf. Its citation rate collapsed from 17.65% to 1.91%. That is the story most people took from the May paper.
Between May 2026 and July 23 2026, on the same 425 prompts, both numbers reversed. Presence fell 34 points to 62.35%. Own-citation recovered 3.7× to 7.17%. The chart everyone screenshotted flipped.
If you stop at the two numbers, you conclude Amazon collapsed. That is the wrong conclusion. Amazon is currently the strongest brand on India's largest AI shopping surface, by every mechanical measure that matters. This piece walks through what actually moved - using live payload data pulled from Supabase on 2026-08-05 - and why the reversal is a success story for Amazon, not a decline.
The three data points, at rest
Same 425 mixer-grinder buyer prompts. Three time points. All numbers pulled live.
| Metric | Jan 2026 | May 2026 | July 2026 |
|---|---|---|---|
| Prompts served (out of locked 425) | 425 | 425 | 425 |
| Presence % (of all 425 responses) | 80.00 | 42.4 | 62.35 |
| Presence % (of carded responses) | 84 | 96.3 | 74 |
| Zero-card responses % | 5 | 56.0 | 16.2 |
| Avg best-Amazon-card position (1-based) | 1.87 | 1.19 | 1.65 |
| Amazon own-citation % of present | 17.65 | 1.91 | 7.17 |
| Cheapest-or-tied % of Amazon cards | 40.76 | 71.2 | 70.7 |
The row that changes everything is the shelf-health row - the zero-card responses. In May, 56% of the 425 prompts returned no shopping cards at all. Not just no Amazon cards. No cards, period. The shelf itself was half shut. On the 44% of prompts where a shelf actually rendered, Amazon was on 96% of them - because there was almost nothing else in the shopping index yet.
By July the shelf had reopened. Only 16% of prompts returned zero cards. On the healthy 84% that carried a shopping carousel, Amazon rode 74% of them. Amazon's share of the carded responses fell from 96% to 74%, sure - because the shelf now has actual competition on it - but Amazon's absolute reach on the buyer universe still grew, going from 42% of all 425 prompts (44.0% carded × 96.3% share) to 62% (83.8% × 74.4%).
The May chart everyone quotes was measured on a bubble.
Amazon is winning the July shelf, hard
Once you correct for shelf health, the July snapshot is not a story of decline. It is the strongest Amazon has ever looked on this surface.
On 2026-07-23, across the 425 locked prompts:
- Amazon is a buy-link on 581 shopping cards.
- Amazon lands at position 1 or 2 on 302 of those (52%).
- Amazon is cheapest-or-tied on 411 of them (71%).
- Amazon holds top-2 AND cheapest-or-tied on 210 cards (36%).
- Amazon holds the top slot AND cheapest on 113 cards.
Two hundred and ten dual-wins across 425 buyer queries in a single category. That is not a story a marketplace tells when it is losing an AI shopping surface. That is the story of a marketplace running the table on the levers that matter.
The sub-intent breakdown is even sharper. On July 23:
| Sub-intent | Responses | Avg cards | Amazon Presence % | Avg best Amazon position |
|---|---|---|---|---|
| Mixers - Specifications | 100 | 2.88 | 79.3 | 1.75 |
| Mixers - Appliances | 90 | 3.20 | 78.2 | 1.69 |
| Mixers - Use Cases | 150 | 3.14 | 76.4 | 1.86 |
| Mixers - Price | 80 | 3.20 | 76.1 | 1.57 |
| Mixers - Regional | 180 | 2.46 | 75.6 | 1.58 |
| Mixers - Brands | 105 | 1.74 | 63.5 | 1.36 |
Amazon is on three of every four cards across every sub-intent. On brand queries specifically - where a shopper has already decided "Preethi" or "Bajaj" and just needs the offer - the shelf thins to ~1.74 cards per response, and Amazon lands at position 1.36. Nearly always the top slot when it shows up. There is no cleaner measure of "the model treats Amazon as the default fulfillment layer for this category."
Amazon got more price-competitive during the "decline"
The cleanest evidence that the May-to-July shift was not a downgrade is what happened to price competitiveness across the window.
| Pull date | Amazon-carrying cards | Cheapest-or-tied % |
|---|---|---|
| 2026-03-06 | 137 | 55.5% |
| 2026-03-25 | 405 | 59.5% |
| 2026-05-12 | 118 | 71.2% |
| 2026-07-23 | 581 | 70.7% |
Amazon's price-competitiveness widened +15 percentage points across the exact period the popular narrative reads as a decline. In March, Amazon was cheapest on 55% of the cards it was on; by July, cheapest-or-tied on 71%. That is Amazon aggressively pricing into the surface, not backing away from it.
And it matters mechanically. OpenAI ships exactly one product-card badge - the tag field is either populated with the string "Best price" or is null. There is no "Editor's choice," no "Top rated," no "Bestseller." Just Best price. Amazon captures:
| Category | Cards with "Best price" badge | Amazon's share |
|---|---|---|
| Mixer grinders (India, 2026-07-23) | 511 | 56% |
| Sunscreens (India, 2026-07-10) | 490 | 63% |
Amazon owns the majority of the only badge OpenAI ships, across both categories where we hold measurement. Given badges materially move buyer click-through in every controlled test that has ever been done on a shopping UI, this is arguably the single highest-leverage placement Amazon holds inside ChatGPT Shopping today. It is a direct payoff of the +15pp price-competitiveness move.
The citation graph rewired - and Amazon citations recovered 5×
The other story most readers took from the May paper was that Amazon had disappeared from the citation graph - from 108 Amazon citations in the January pull to 8 by May. That number bottomed and reversed too.
| Pull date | Amazon citations | vs May |
|---|---|---|
| 2026-02-18 | 79 | - |
| 2026-03-06 | 17 | - |
| 2026-03-25 | 15 | - |
| 2026-05-12 | 8 | baseline |
| 2026-07-23 | 42 | 5.25× |
Amazon's citation count did not recover to the January peak, but it recovered quickly - a 5× rebound in about ten weeks. And the rebound coincides with a broader rewire of the entire citation graph. Eight of July's top-15 cited domains are new compared with May:
| Rank | May 2026 (locked-425) | July 2026 (locked-425) |
|---|---|---|
| 1 | bestmixergrinder.com - 187 | bestmixergrinder.com - 784 |
| 2 | bestmixie.in - 158 | reddit.com - 533 |
| 3 | reddit.com - 130 | digit.in - 464 (new to top 15) |
| 4 | wonderchef.com - 128 | smartprix.com - 375 |
| 5 | smartprix.com - 114 | hindustantimes.com - 292 (new) |
| 6 | moglix.com - 72 | producthunter.in - 257 (new) |
| 7 | digit.in - 70 | philips.co.in - 257 (new - brand-owned) |
| 8 | myg.in - 65 | bestmixie.in - 198 |
| 9 | adify.store - 61 | croma.com - 184 (new) |
| 10 | reliancedigital.in - 61 | moglix.com - 167 |
| 11 | meesho.com - 60 | shop.preethi.in - 132 (new - brand-owned) |
| 12 | reviewspot.co.in - 57 | flipkart.com - 125 (1 → 125) |
| 13 | kitchendeals.in - 49 | etadviser.com - 113 (returned) |
| 14 | choicely.in - 45 | adify.store - 112 |
| 15 | hassanchef.com - 42 | bajajelectricals.com - 109 (new - brand-owned) |
Three shifts jump out:
Reddit lost #1 to bestmixergrinder.com, which more than quadrupled (130 → 533 for Reddit, 187 → 784 for bestmixergrinder). The community layer is not shrinking; the SEO-farmed affiliate layer is compounding faster.
Legacy editorial partially returned. digit.in, hindustantimes.com and etadviser.com came back after being pushed out in May. The model is finding editorial coverage again - just not the same coverage it was reading in January.
Brand-owned domains broke in for the first time. philips.co.in (#7), shop.preethi.in (#11), and bajajelectricals.com (#15) are direct manufacturer websites. This pattern was a rounding error in every prior pull. As of July, three separate manufacturer domains hold top-15 slots and their combined weight in the graph rose to 689 cites - an all-time peak, +75% over the February baseline.
Flipkart re-entered the top 15 at 125 cites, up from a single citation in May. Marketplace citation is diversifying beyond Amazon - but Amazon still dominates the buy-link layer, which is where the transaction actually happens.
Why the two layers keep moving independently - and why that is the right thing to see
The two-layer model argues that an AI shopping answer has two independent surfaces - what gets recommended (placement) and what gets attributed (citation) - and that they should be tracked separately. May's data was the first strong evidence: placement rose while citation fell. July's data is the second, cleaner piece of evidence: placement fell while citation recovered.
Two reversals, in opposite directions, on the same prompts, in the same category, inside eight months.
If you had built your entire AI-visibility dashboard around a composite score that blends the two, both reversals would have cancelled to a flat line while the underlying reality shifted radically twice. A brand that only tracked Presence would have seen a five-alarm fire in July with no diagnostic to explain it. A brand that only tracked citation share would have missed the entire January-to-May story.
Amazon's specific reversal has a clean mechanical explanation: brand-owned domains eating attribution slots on Preethi / Philips / Bajaj queries pushed the reason for the recommendation toward those sites - while Amazon's price discipline held the recommendation itself on the buy-link. Two levers moving in opposite directions, both real.
Why this is Amazon's success story, not a decline
Compressed, the July 2026 state of Amazon in ChatGPT Shopping:
- 210 dual-wins on 425 buyer prompts - top-2 slot + cheapest-or-tied.
- 56% of the "Best price" badge on kitchen appliances, 63% on beauty - Amazon owns OpenAI's single lever for card differentiation.
- +15pp cheapest-or-tied swing across the "decline" window - Amazon got more competitive, not less.
- Position 1.36 on brand queries - nearly always the top slot when a shopper has decided on a brand.
- Amazon citations recovered 5× - 8 in May to 42 in July, alongside a graph rewire that added flipkart.com back at 125 cites.
- 74% presence on the healthy carded shelf - the biggest single share of any retailer on this surface.
The right way to read the May-to-July shift is not "Amazon lost 34 points." It is "the shelf finally healed, Amazon's dominance is now measured against a real competitive set, and Amazon still wins." A brand that wants to compete for Amazon's slots inside ChatGPT - and there are now brand-owned domains trying, quite visibly - has to close the price-competitiveness gap and the review-count gap before it can touch Amazon's dual-win share. Neither is quick.
What this means for anyone else measuring Amazon in AI shopping
If you are building an AI-visibility dashboard right now that tracks Amazon (yours or a competitor's), three changes to make on Monday:
- Report Presence twice - once on all prompts, once on carded prompts. The gap between the two is the shelf-integrity story. If your presence number moves and the gap between the two moves with it, the story is about the shelf, not about you.
- Track the badge. ChatGPT's
tagfield only ever contains"Best price". Track the count of your cards that hold it, weekly, by category. It is the single-highest-leverage visual differentiator on the surface. - Watch the graph, not just the citation number. The top-15 cited-domain leaderboard tells you what the model is reading - a brand-owned domain entering that list is the earliest signal you will get that a placement move is coming.
The same measurement-first loop drove our Amazon India engagement, where Top-5 presence rose +2.4% in 6 weeks - see the Amazon case study. The usual first step is Share of Voice.
FAQ
On the same 425 locked buyer prompts, Amazon's Presence % is quoted as falling from 96.26% to 62.35% - but those are two different denominators: the May figure is Amazon's share of *carded* responses, the July figure its share of *all* prompts. That is a real move on that metric. But the May 96% was measured on a half-empty shelf - 56% of responses that month returned zero cards. July's shelf is about three times healthier (16% zero-card). Like for like, Amazon's absolute reach on the buyer universe rose from 42.4% to 62.4% of the panel, and Amazon still holds top-2 slot + cheapest-or-tied on 210 of the 425 prompts.
Yes, by every mechanical measure available on live July 2026 data. Amazon holds 74% presence on the carded shelf, captures 56-63% of OpenAI's only badge ("Best price"), and lands at avg position 1.36 on brand queries. No other retailer or brand is close on this surface today.
Eight of July's top-15 cited domains are new since May. bestmixergrinder.com more than quadrupled and displaced Reddit as #1. Brand-owned manufacturer domains (philips.co.in, shop.preethi.in, bajajelectricals.com) broke into the top 15 for the first time. Flipkart citations jumped from 1 to 125. Amazon citations recovered 5.25× (8 → 42).
Yes. Amazon's cheapest-or-tied rate widened +15 percentage points across the window - from 55.5% in March to 70.7% in July. Amazon aggressively priced into the surface, and the payoff is winning the majority of the "Best price" badge (56% on mixer grinders, 63% on sunscreens).
All 425 locked prompts were served in the July 23 batch, 423 returned citations, 356 returned shopping cards, avg 3.5 cards per response. Data coverage matches prior healthy pulls. The ~69 responses that returned zero cards are a separate real signal - the shelf itself thinned on that ~16% subset.
Continue reading
August 7, 2026
Query Fan-Out: One Question Becomes 5-7 Searches (And ChatGPT Rewrites All of Them)
A user typed 'ALTRR Portable Spice Mill (200W)' into ChatGPT. The shopping backend searched 'portable spice grinder travel' - brand stripped, spec dropped, intent added. That rewrite is stamped into every card's payload as generated_product_query, and it is only one branch of a fan-out that turns a single buyer question into 5-7 sub-queries across 8 distinct axes. Classical SEO optimizes one keyword per page. AI shopping ranks you across the whole fan-out - which is exactly why Amazon holds 63-79% presence on every sub-intent type we measure.
August 7, 2026
The 86% Rule - In AI Shopping, Eligibility Beats Ranking
When a retailer product page gets cited in a ChatGPT shopping answer, it wins the top recommendation slot 86.03% of the time - the highest hit rate of any content type in an 18,942-citation dataset. But retailer pages are only 8.28% of what ChatGPT cites. That inversion rewrites the whole playbook: the scarce, high-conversion battle in AI shopping is getting cited at all, not ranking once cited. Here are the three gates that decide citation eligibility - reviews, product-type fit, sub-intent presence - and the two beloved PDP levers that tested statistically dead.
August 7, 2026
AI Visibility Has Two Layers: The Placement vs Citation Dashboard That Actually Works
AI shopping answers have two independent layers - the products the model recommends (placement) and the sources it attributes the answer to (citation) - and every brand's AI-visibility dashboard is quietly blending them into one number that lies. On Amazon's India mixer-grinder data, one layer is 61.48% and the other is 0.78% - a 79× gap. On sunscreens the same structural pattern holds at 25×. And both layers moved in opposite directions twice in eight months. Here is the four-KPI-group model that fixes it.