
The Citation Graph Rewires Itself — Editorial, Then Community, Then Niche Affiliate
The set of domains ChatGPT cites to justify its shopping answers is not stable — it churns fast. Across seven monthly pulls of one locked panel, the leaderboard rewired from mainstream editorial to community to niche affiliate: Reddit climbed from #4 to #1 (203 to 466 citations), four of Run 7's top five did not exist in Run 1's top five, and amazon.in fell out of the top 20 entirely even as its buy links kept winning slots. If you track your own page instead of the graph, you cannot see the ground moving under your placement — here is the data, the mechanism, and what to watch.
Viren Inaniyan · September 11, 2026 · Citation Rank & Share of Voice
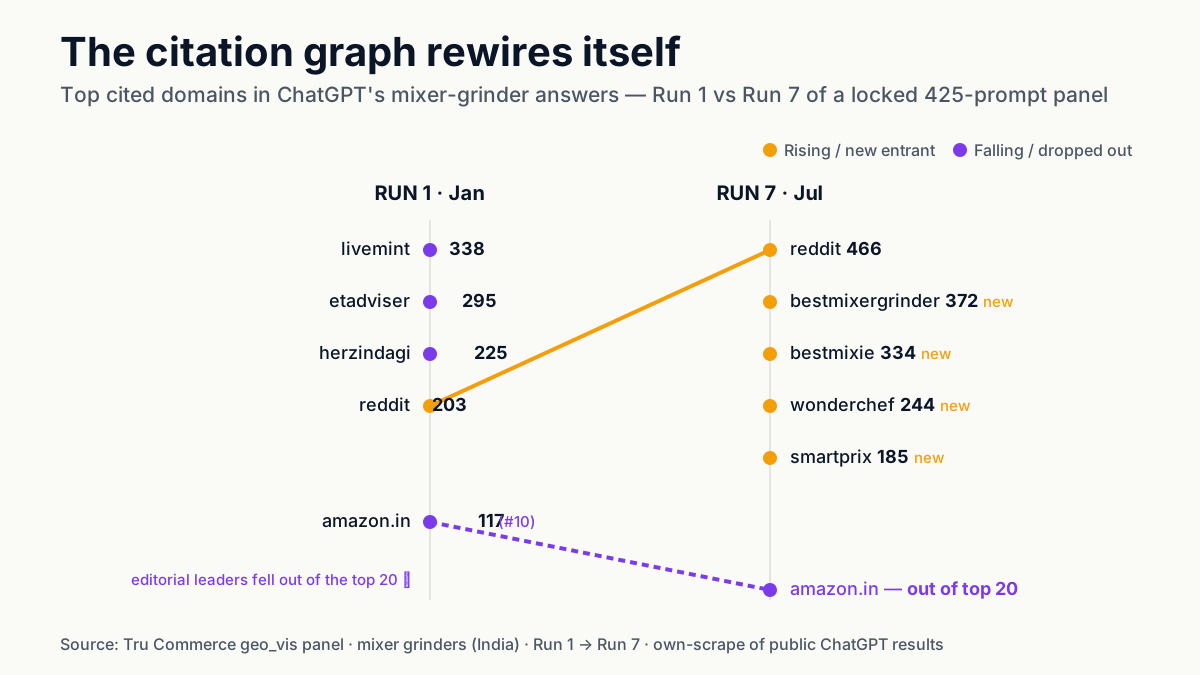
The list of domains ChatGPT cites to justify a shopping answer is not a fixed set — it churns, fast, and in a direction. Across seven monthly pulls of one locked panel, the citation graph rewired from mainstream editorial to community to niche affiliate. Reddit went from #4 to #1. amazon.in fell out of the top 20 entirely — while its buy links kept winning slots. If you track your own page instead of the graph, the ground can move under your placement and you will not see it happen.
A brand-visibility lead at a kitchen-appliance company asked us a sharp question recently: "We finally got cited by ChatGPT last quarter. How long does that last?" The honest answer is: probably not as long as you think, and the reason is not that your page got worse. It is that the model keeps changing which pages it reads. This piece is the data on how fast, and in what direction.
This is the ninth piece in our Winning in AI Visibility with Amazon series, built on the same measurement spine as the rest: a locked panel of 425 real buyer prompts (mixer grinders) re-run monthly against ChatGPT's shopping surface, with every cited source stored by domain in our geo_vis schema. Earlier pieces looked at single domains — Reddit's rise as the evidence layer, the collapse and reversal of the marketplace's own citations. This one zooms out to the whole graph and watches it turn over.
What the leaderboard looked like, seven pulls apart
We take the same panel at Run 1 and Run 7, count citations by domain, and rank them. Two leaderboards, one category, roughly six months apart:
| # | Run 1 top cited domains | Run 7 top cited domains |
|---|---|---|
| 1 | livemint — 338 | reddit — 466 |
| 2 | etadviser — 295 | bestmixergrinder — 372 |
| 3 | herzindagi — 225 | bestmixie — 334 |
| 4 | reddit — 203 | wonderchef — 244 |
| 5 | (editorial / mixed) | smartprix — 185 |
| … | ||
| 10 | amazon.in — 117 | (out of the top 20) |
Read the two columns side by side and the story is not subtle. Run 1's top of the graph is mainstream editorial — a business daily, a lifestyle-advice site, a women's-lifestyle publisher. Run 7's top of the graph is a community platform followed by a run of niche affiliates: two dedicated mixer-review sites, a brand-owned domain, a price-comparison aggregator. Four of Run 7's top five were nowhere near Run 1's top five. The editorial leaders that opened the panel are gone from the front of it.
Two individual moves inside that reshuffle carry most of the meaning. Reddit climbed from #4 to #1, 203 citations to 466 — a 130% rise — which is the whole-graph version of a story we told at the single-domain level in Reddit Is the New PDP. And amazon.in went the other way: #10 in Run 1, out of the top 20 by Run 7. Its own-page citation share — the share of the marketplace's appearances where the model cited an amazon.in URL as evidence — fell from 17.65% to 1.91% across the panel.
Here is the part that keeps this from being a doom story. Over the same window the marketplace's buy links still held roughly 27–28% of recommendation slots, and its overall presence in answers actually rose. The recommendation and the justification come from different places — a split we mapped in the two-layer model. amazon.in stopped being cited as evidence and kept winning the sale, because the niche affiliates that replaced it in the graph list its offer. Its buy link now wins from other people's citations.
Why the graph migrates in one direction
The direction — editorial, then community, then niche affiliate — is not random churn. It follows from how the retrieval system is built and what it is rewarded for.
Start with why the graph matters at all. In our measurement, 84.6% of the products ChatGPT recommends trace back to its cited sources, and over 95% of those citations are external — third-party pages, not the brand's or the marketplace's own. So the citation graph is not a footnote to the recommendation; it is the substrate the recommendation grows out of. Whoever the model reads decides who it recommends.
Now the migration. Mainstream editorial is where a cold model starts, because it is authoritative, well-linked, and easy to trust. But a business daily's mixer article answers "what are some good mixers" in general terms. As the surface matures and shoppers ask sharper, more comparative questions — the query rewriting we covered in query fan-out — the model needs sources shaped like those questions. Community threads answer "which one survives daily use" with disagreement and six-months-later reports. Niche affiliate sites answer "best mixer under X for wet grinding" with tables, specs, and buy links already attached. Both match the rewritten query far better than a general editorial roundup, so both rise, and the editorial leaders that cannot match the question shape drift down and out.
That is why amazon.in falling out of the graph and the niche affiliates entering it are the same event. A product listing states what a product is. It does not compare, it does not disagree, and it carries an obvious incentive — so as the model's taste in evidence sharpens toward comparative, third-party text, the listing loses its place at exactly the moment the comparison sites gain theirs.
The news hook: the infrastructure headline and the graph underneath it
It is worth naming the thing that will dominate the headlines while this quieter rewiring goes unwatched. The Amazon–OpenAI partnership reported in the press is a compute arrangement — cloud capacity for training and inference at a multi-billion-dollar scale — not a commerce-citation deal. It does not put the marketplace's pages back into the evidence base, and nothing in our panel suggests it changed which domains ChatGPT cites for shopping. The infrastructure layer and the citation layer are different layers. While the first makes news, the second kept rewiring on its own monthly schedule, indifferent to it. Optimizing to the headline is exactly the mistake this piece is about: watching the loud layer instead of the one that decides your placement.
Two qualifications, to keep this honest
First, this is one category — mixer grinders, India — measured over seven monthly pulls. The specific domains on these leaderboards are category-specific and will not transfer; your category's graph has its own editorial names, its own communities, its own affiliates. What transfers is the pattern and the volatility: the migration from editorial to community to niche affiliate, and the pace at which the front of the graph turns over. Treat the exact names here as an illustration, not a target list.
Second, a leaderboard ranked by raw citation count is not the same as one ranked by influence. A domain cited many times across peripheral answers can outrank one cited a few times on the decisive ones. We rank by raw counts because they are auditable and reproducible from the stored graph, but count is a proxy for importance, not a measure of it. The honest read of the table above is directional — editorial down, community and affiliate up — not a precise pecking order.
What this means if you sell on marketplaces
Your dashboard almost certainly tracks your own citations: are we cited, how often, trending up or down. That number can go to near-zero while your sales hold — that is precisely what amazon.in did. If you manage to your own-citation line alone, you will read a collapse where there is a healthy shelf, panic, and possibly "fix" a KPI that stopped mapping to reality. Track the graph instead: the full leaderboard of who the model cites in your category, and whether the domains that carry your offer are rising or falling in it. Your placement is only as durable as the citers propping it up.
What this means if you run a D2C brand
For a D2C brand the volatility is the opportunity, and the reason is structural. Google's first page in a mature category barely moves quarter to quarter; displacing an incumbent is slow and expensive. A citation graph where four of the top five turn over in six months has no entrenched incumbents to displace. Presence in it is being set right now — and cheaply, because almost no brand is competing for it deliberately. Two of Run 7's top-five domains are a community platform and a brand-owned site: both are earnable without an ad budget. This is the same argument we make for share of voice as a tracked metric — the graph is where share is won or lost, so it is where share has to be measured.
What not to do
Do not treat a single cited placement as a moat. It is a lease, not a deed, on a graph that rewrites itself every few pulls — the visibility-lead's question at the top of this piece has a number attached to it now, and the number is "not long." And do not chase the exact domains on someone else's leaderboard, including ours. By the time a name is on a published table it is already contested and possibly already falling; the four new entrants in Run 7 are more instructive as a rate of change than as a shopping list. Measure your own graph, watch its churn, and place where the migration is heading — comparative, community, third-party — rather than where it has been.
The measurement habit
Same discipline as the rest of this series, one layer up. A locked prompt set for your category, re-run on a schedule, with the full citation graph stored by domain per pull. Watch two numbers: your share of the graph, and the graph's churn rate — how many of the top domains changed since last pull. The first tells you whether you are becoming evidence. The second tells you how much time your current placement has. A graph that turns over this fast rewards the team that is looking at it and quietly punishes the team looking at its own page. Book a demo if you want your category's graph tracked the way we track this one.
The domains ChatGPT trusts today are not the ones it trusted two pulls ago, and they are not the ones it will trust two pulls from now. That is uncomfortable if you were counting on a citation you earned. It is a gift if you are the one measuring the movement.
Next in the series: Product-Type Determines Destiny — why some categories are structurally 15–20× more citable than others, and how category selection becomes a visibility lever.
FAQ
It is the set of external domains an assistant cites as evidence when it answers — the sources behind a recommendation, not the products it recommends. It matters because in our measurement 84.6% of the products ChatGPT recommends trace back to its cited sources, and over 95% of those citations are third-party pages, not the brand's own. Who the model reads decides who it recommends, so the graph is the layer to watch.
Not on the evidence we can see. The Amazon–OpenAI partnership reported in the press is a compute arrangement — cloud capacity for model training and inference — not a commerce-citation deal. Underneath that infrastructure headline, the domains ChatGPT actually cites for shopping answers kept rewiring on their own schedule, month to month, in our panel.
The same way amazon.in did while its own citations collapsed: your buy link can surface from other people's citations. The model builds its evidence base from community threads, buying guides, and niche affiliate sites; if those pages carry your offer, you can win the slot without being cited yourself. The risk is that you cannot see this happening unless you track the whole graph rather than your own domain.
Sources
Continue reading
October 12, 2026
How a Claude shopping agent picks products
Anthropic ships no ranking layer. A Claude for Commerce shopping agent reads compact catalog rows of 70 to 120 characters that the merchant's own search returns, adds only server-issued ids to the cart, and never sees the checkout URL. Claude in Chrome reads the page and asks before buying. What is documented, what is not, and who filled the gap.
October 12, 2026
Claude commerce agents: what a merchant has to build
Anthropic's blueprint of 2 September 2026 hands a merchant's engineers a shopping agent, a merchant agent and an 11-method backend contract, and leaves payments, authorization, ranking and fraud to the deployment. The three runtime paths, where MCP enters, Shopify's UCP implementation, and what to build first.
October 12, 2026
Claude for Commerce explained: what Anthropic shipped
Anthropic published its commerce agents blueprint on 2 September 2026: a shopping agent and a merchant agent as open-source reference code, payment left to the merchant. What shipped, who is named, what the 35% figure describes, and what is still missing.