
Measurement Is the Moat — Why Every AI-Visibility Number Lies Without a Locked Prompt Set
The same Amazon-present count reads 80% on a locked 425-prompt denominator and 74.89% on a full 454-response one — the number moves five points on the denominator alone. Add runs with zero cards, partial card coverage, and a position metric that swings from 0.41 to 1.41 depending on where you start counting, and most AI-visibility dashboards are quietly reporting fiction. This piece shows the exact ways a number lies, includes a correction we owe our own data, and gives the validity checklist that has to run before any figure ships.
Viren Inaniyan · September 10, 2026 · Citation Rank & Share of Voice
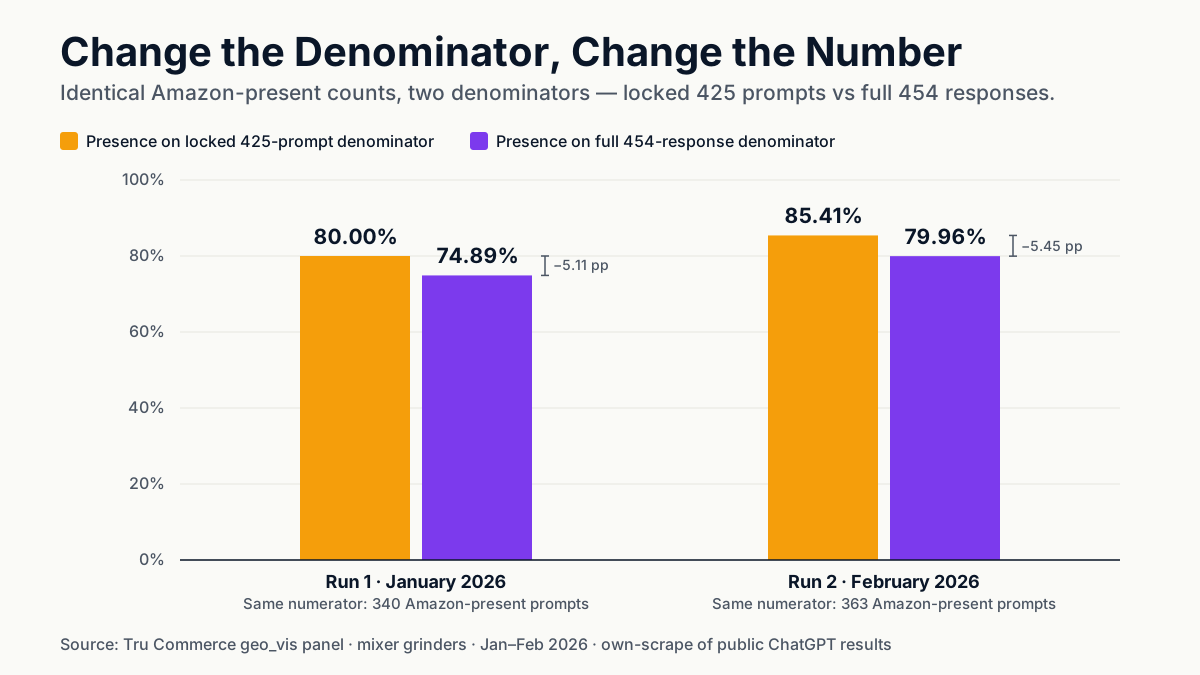
The same count reads 80% or 74.89% depending on which denominator you divide by. Same prompts, same month, same Amazon appearances — a five-point gap that is entirely an artifact of measurement. This piece shows the exact ways an AI-visibility number lies without a locked prompt set, publishes a correction we owe our own data, and gives the validity checklist we now run before any figure leaves the building.
An analytics lead at a D2C brand asked us, after a good-looking dashboard demo from another vendor, a question we wish more people asked: "How do I know the number is real?" It is the right question, and the honest answer is uncomfortable — most AI-visibility numbers you will see this year are not wrong on purpose, they are just unspecified. They report a percentage without telling you what it is a percentage of. And in a measurement surface this noisy, the denominator is doing more work than the data.
This is the twelfth piece in our Winning in AI Visibility with Amazon series, and it is the one about the instrument rather than the reading. Everything else in the series stands on the same spine: a locked panel of 425 real buyer prompts (mixer grinders) re-run monthly against ChatGPT's shopping surface and stored in our geo_vis schema. This piece is about why the word locked is the most important one in that sentence.
One count, two numbers
Start with the cleanest example we have. In our January and February pulls, we counted the prompts where Amazon appeared at any rank — the presence metric. The numerators are not in dispute; we validated them against the live database to the exact prompt. Here is what happens when you divide those same numerators two defensible ways.
| Run (2026) | Amazon-present prompts | Presence on locked 425 | Presence on full 454 |
|---|---|---|---|
| Run 1 · January | 340 | 80.00% | 74.89% |
| Run 2 · February | 363 | 85.41% | 79.96% |
Nothing about Amazon changed between the two columns on the right. The 80.00% divides 340 by the locked set — the 425 prompts that are complete in every run we compare. The 74.89% divides the same 340 by all 454 responses the scraper captured that month, including partials and prompts that appear in one run but not another. Five points of "movement," and not one point of it is about visibility. It is about arithmetic.
If you take one thing from this piece: a presence number without a stated denominator is not a low-quality metric, it is not a metric at all. It is a number waiting for a story to be told about it.
The correction we owe our own data
We are going to spend the rest of this piece being hard on unspecified numbers, so it is only fair to start with one of our own that was wrong.
An early internal read of one month's pull reported that roughly 87% of responses had no shopping card — an alarming figure that, taken at face value, would have said the shopping surface had all but collapsed in the category. It was wrong. On re-validation, the real figure was about 56%. The gap was not a data change and not a model change. It was a response-selection bug: partial captures — responses where the scraper had stored the answer text but not every card — were being counted as zero-card responses. A response that actually had cards we simply hadn't finished writing was being tallied as a response with no cards at all.
Thirty-one points of error, from a single unstated assumption about what "counts" as a complete response. We caught it because we re-ran the query against the live store with an explicit completeness rule and the number moved by half. We are telling you about it because it is the cleanest argument we have for the discipline this whole piece is recommending: the number that ships should never be the first number the query returns. It should be the number that survives a validity check. Ours didn't, the first time.
Three ways a number lies without a locked set
The 87/56 error was one species of the same underlying problem. Here are the three we see most often, each of which quietly corrupts a metric that looks perfectly healthy on a dashboard.
A run with zero cards. One of our monthly runs returned 425 responses and zero shopping cards — every card-based metric for that run is undefined, not low. A naive pipeline does not know the difference. It will compute presence, Top-3, and share-of-voice over a run with no cards to measure and return numbers that look like data. The only defense is a check that refuses to report a card metric when there are no cards, rather than dividing by whatever it finds.
Partial card coverage. Two later runs captured cards for only 137 to 209 of the 425 prompts. This is worse than a zero-card run because it does not announce itself. Any "Top-N" metric — Top-3, Top-5, best-position share — now runs over a shrunken, self-selected slice of the panel, and self-selected in a way you don't control: whichever prompts happened to capture cleanly. The percentage looks comparable to a full run. It is not. It is a different, smaller, biased population wearing the same label.
Position that depends on where you start counting. Our card rank is 0-based — the top card is position 0. Average the best Amazon card per response on that index and you get roughly 0.41. Add one to read it as a human would, 1-based, and the same cards in the same order average about 1.41. A full point of difference, and none of it is about ranking. It is about a convention nobody stated. We now report "average best-card position, 1-based" as the defensible default — but the point is not which convention wins. The point is that a position number without its definition is off by up to a whole rank, and you cannot tell which way.
Two qualifications keep this honest. First, none of these are exotic bugs; they are the ordinary texture of scraping a surface that changes under you, and any team measuring AI visibility at volume will hit all three. Second, the fix is not more data — it is a stricter definition of what counts as a valid, complete, comparable observation before a single percentage is computed.
Why measurement is the moat
It is tempting to file all of this under hygiene. It is not hygiene. It is the moat.
Every strategic claim in this series depends on a number being trustworthy across time. When we showed that placement and citation are two separate layers that can move in opposite directions, that finding only holds because presence and citation were measured on the same locked set, run over run. When we showed that a cited product page wins the top slot most of the time, the "most of the time" is a rate over a defined denominator — change the denominator and the headline changes with it. And when we documented a citation collapse and its reversal on the Amazon shelf, the only reason we could tell a real reversal from a measurement artifact was that the instrument had not moved.
The moat is this: the surface itself is unstable. The model that answers a shopping query is not a fixed thing — in our own teardown of ChatGPT's shopping surface we found the answers served by a shifting mix of model versions and feed partners, changing month to month. When the thing you are measuring moves and your instrument moves, you learn nothing. A competitor with a locked prompt set, a stated denominator, and a validity check learns exactly how the surface shifted. That asymmetry compounds. It is not a nicer dashboard; it is a better sense of reality, held over quarters, while everyone else argues about numbers that were never comparable in the first place.
What this means for you
If you sell on marketplaces: insist on the denominator. When any tool or team hands you a presence, share-of-voice, or Top-N figure, the first question is "over what set of prompts, captured how completely?" If the answer is a moving list of whatever the scraper caught that day, the trend line you are looking at is partly a trend in scraping, not in visibility. Ask for the locked set and the completeness rule in writing.
If you run a D2C brand: the temptation is to celebrate the month the number jumps. Before you do, check whether the panel changed. A five-point presence gain that turns out to be a denominator that shrank by five points is not a win — it is the 80-versus-74.89 illusion in a different costume. The teams that will win the AI shelf are the ones who can tell the difference, and telling the difference is a measurement capability, not a marketing one.
What not to do: do not benchmark yourself against a competitor's headline number unless you know how they built it. Two vendors can measure the same brand on the same day and report presence ten points apart, both honestly, purely on denominator and completeness choices. Comparing across methodologies is not comparing — it is theater with a chart.
The measurement habit
The habit is small and boring, which is why it is a moat: almost nobody keeps it. Before any AI-visibility number leaves our hands, it passes a validity checklist. A response counts only if it has a captured answer, at least one citation, and at least one shopping card. The denominator is the locked set — prompts complete in every run being compared — and it is stated next to every percentage. Card metrics are refused, not defaulted, when a run has no cards. Position carries its definition: best card per response, 1-based. And every number is reconciled against the live store before it ships, because the first number a query returns is a draft, not a fact.
That checklist is the whole product philosophy behind Citation Rank: a locked panel, a stated denominator, and a validity gate that runs before the chart renders — so the number you act on is the number that survived scrutiny. If you want the full version — the checklist, the denominator rules, and the queries we run to catch the three failures above — we packaged it as a measurement playbook. Book a demo and we will walk you through it against your own category.
The number is not the moat. The trustworthy number is. And a number is only trustworthy when you can say, out loud and in writing, exactly what it is a number of.
Next in the series: The Variant-Fragmentation Myth — why consolidating your product variants can quietly cost you visibility, and what the data says to do instead.
FAQ
A locked prompt set is a fixed list of buyer prompts — ours is 425 real mixer-grinder queries — re-run on a schedule so every pull is measured against the same questions. It matters because without it your denominator changes every run: new prompts, dropped prompts, or partial captures move the percentage even when the underlying visibility hasn't changed. The lock is what makes two months comparable.
Both use the identical numerator — 340 prompts where Amazon appeared. The 80.00% divides by the locked set of 425 prompts; the 74.89% divides by the full 454 responses captured that run. Nothing about Amazon's visibility changed between the two figures. Only the denominator did. That is why every presence number has to state its denominator to mean anything.
State whether the index is 0-based or 1-based, and whether you average the best card per response or every card appearance. Our card rank is 0-based (the top card is 0), so the best-Amazon-card position averages ~0.41; add one for a 1-based reading and it's ~1.41. Same cards, same order — a full point apart. We report 'average best-card position, 1-based' as the defensible default.
Sources
Continue reading
October 12, 2026
How a Claude shopping agent picks products
Anthropic ships no ranking layer. A Claude for Commerce shopping agent reads compact catalog rows of 70 to 120 characters that the merchant's own search returns, adds only server-issued ids to the cart, and never sees the checkout URL. Claude in Chrome reads the page and asks before buying. What is documented, what is not, and who filled the gap.
October 12, 2026
Claude commerce agents: what a merchant has to build
Anthropic's blueprint of 2 September 2026 hands a merchant's engineers a shopping agent, a merchant agent and an 11-method backend contract, and leaves payments, authorization, ranking and fraud to the deployment. The three runtime paths, where MCP enters, Shopify's UCP implementation, and what to build first.
October 12, 2026
Claude for Commerce explained: what Anthropic shipped
Anthropic published its commerce agents blueprint on 2 September 2026: a shopping agent and a merchant agent as open-source reference code, payment left to the merchant. What shipped, who is named, what the 35% figure describes, and what is still missing.